Heatmaps & Session Recordings: How to Optimize Your Website Using User Behavior

Key Takeaways
- Heatmaps and session recordings reveal how users actually interact with your website, not how teams assume they do.
- Behavioral insights explain why users hesitate, ignore CTAs, or abandon forms; something traditional analytics cannot show.
- Different heatmap types uncover different problems, from missed content and layout issues to visual distractions.
- Session recordings expose friction in forms, checkouts, and lead funnels that silently hurt conversions.
- User behavior data helps teams prioritize fixes that improve usability and conversions instead of cosmetic changes.
- Better visibility of content and CTAs improves engagement signals that support long-term SEO performance.
- Data-driven optimization reduces guesswork, shortens testing cycles, and leads to more stable conversion growth.
The reason most websites fail isn’t that they’re not getting traffic. They are undermined because decisions are made on the basis of assumptions rather than evidence. Teams redesign pages, shift CTAs,, or rewrite content based onbased on opinions, trends,, or gut feelings because they don’t really understand how users truly browse the site. Because of this, even well-crafted websites silently bleed conversions, attention, and trust.
Traditional tools for analyzing performance tell you what happened but seldom elucidate why. Metrics such as bounce rate, time on page , or exits display results, but offer no insight into behavior. They are unable to inform you where users paused, what they overlooked, or which parts were confusing. This missing void results in teams guessing, especially when performance tanks, and there is no clear reason why.
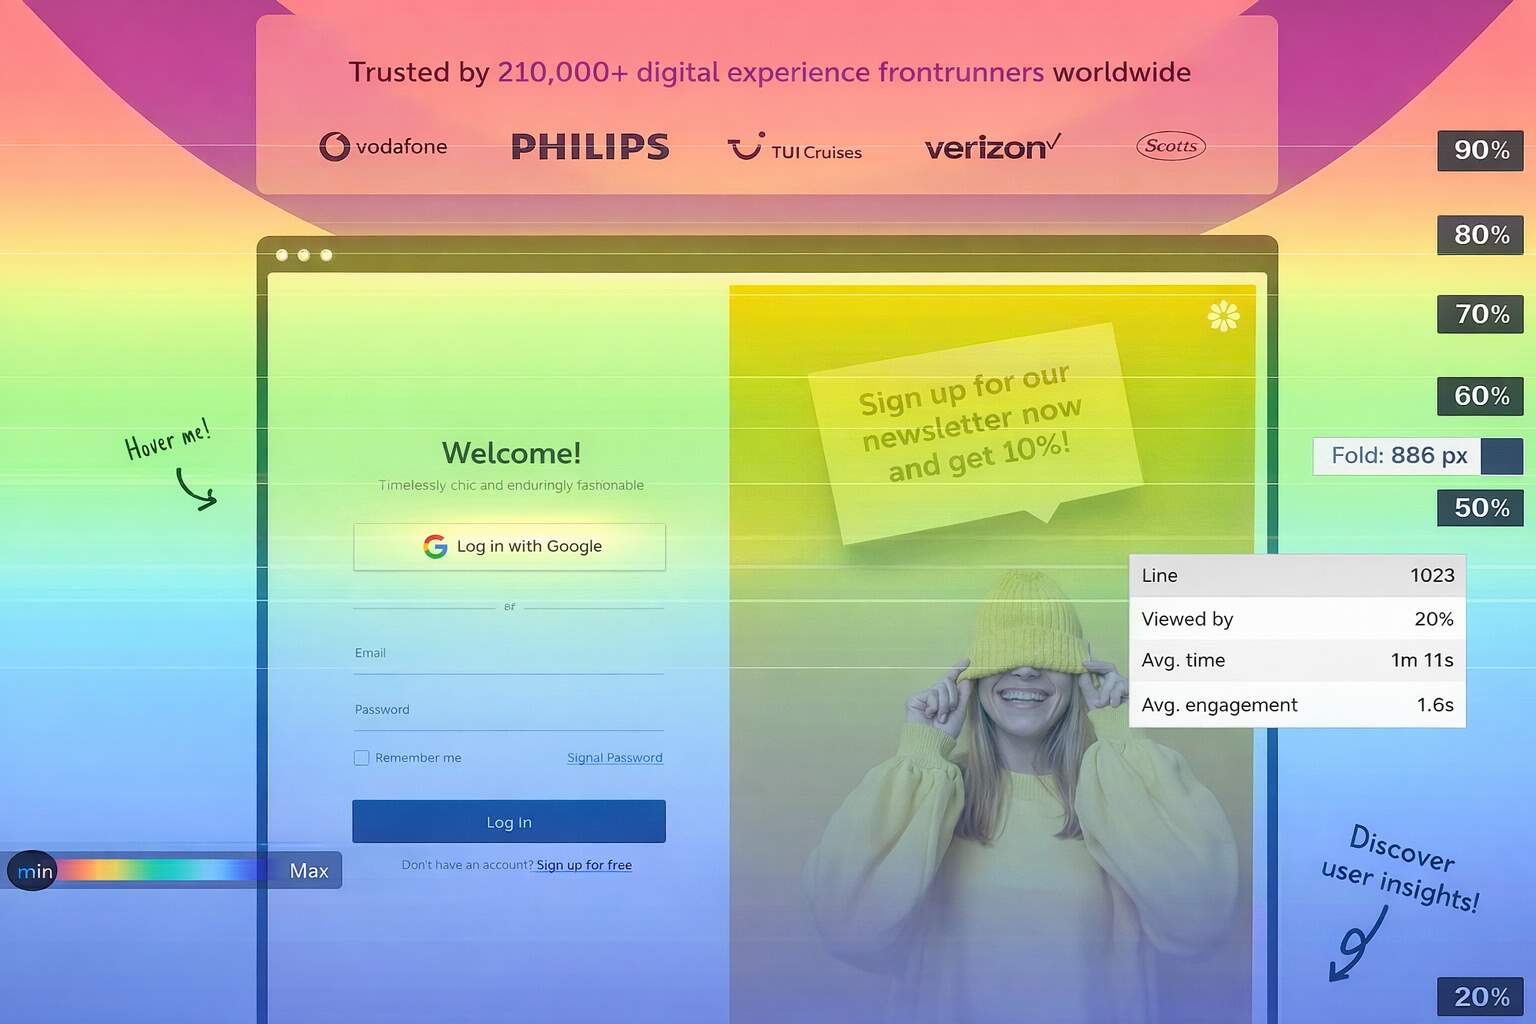
This is where Heatmaps and session recordings shift the conversation. Rather than showing abstract numbers, these tools show how users are actually interacting on a page. You’ll see where visitors click, how far they scroll on your pages, when attention starts to fade, and when frustration is likely to appear. This type of visibility turns unseen friction into obvious, actionable awareness.
Behavioral data is a competitive advantage when leveraged effectively. Whereas competitors are using guesses, the companies using user behavior analytics are making decisions based on real patterns of interaction. The end result is a more intelligent prioritization, better experiences for users, and evidence-based optimization rather than guesswork.
What Are Heatmaps and Session Recordings?
Heatmaps and session recordings are qualitative analytics tools that help you understand how people actually interact with a website (rather than what teams think they do). Unlike classic KPIs, which communicate outcomes themselves, these instruments visualize behavior, showing friction points, user confusion, and missed opportunities across key pages.
Heatmaps and session recordings capture interactions, then visually represent them as patterns. Heatmaps present aggregate behavior (clicking, scrolling, and attention focus) to the developer. Such insights are often organized into click, scroll, and movement or attention-based heatmaps, which provide visibility into different areas of engagement and usability.
Session recordings, also known as session replay tools, record single-user journeys. They illustrate how a live visitor browses pages, clicks through sections, works with forms, and responds to delays or errors. Teams watch these recordings to get a sense of pauses, back-and-forth between actions, or times when users drop out of tasks altogether.
When integrated with traditional analytics platforms, these tools provide crucial context. Analytics might indicate a decrease in conversions, but user behavior analytics tells why the drop happened. Taken together, quantitative metrics and behavioral data analysis offer a far more complete picture of user intent, with optimization decisions being both more accurate and less dependent on guesswork alone.
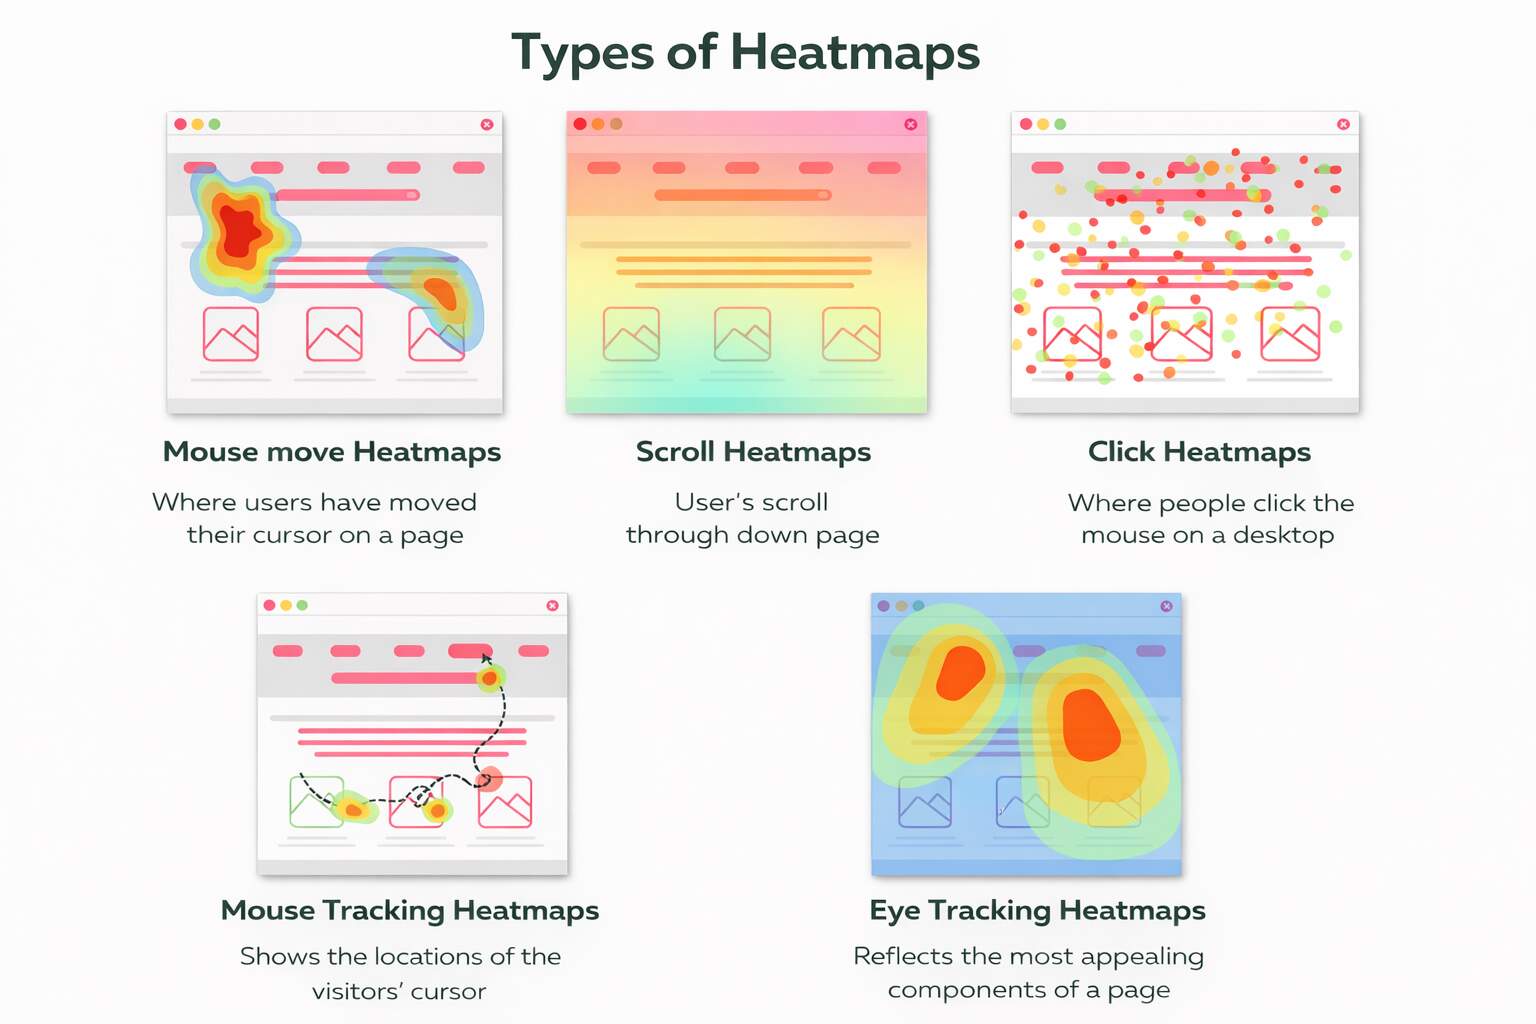
Types of Heatmaps and What They Reveal
-
Click Heatmaps
Click heatmaps (click maps) show where users are actually clicking on a page and which buttons, links, images, or elements draw their focus. They assist in assessing the effectiveness of CTAs, detecting deceptive click areas, and identifying elements that users assume are clickable but are not. This type of website heatmap analysis is particularly helpful for determining whether key actions are where they should be and aren’t being ignored.
-
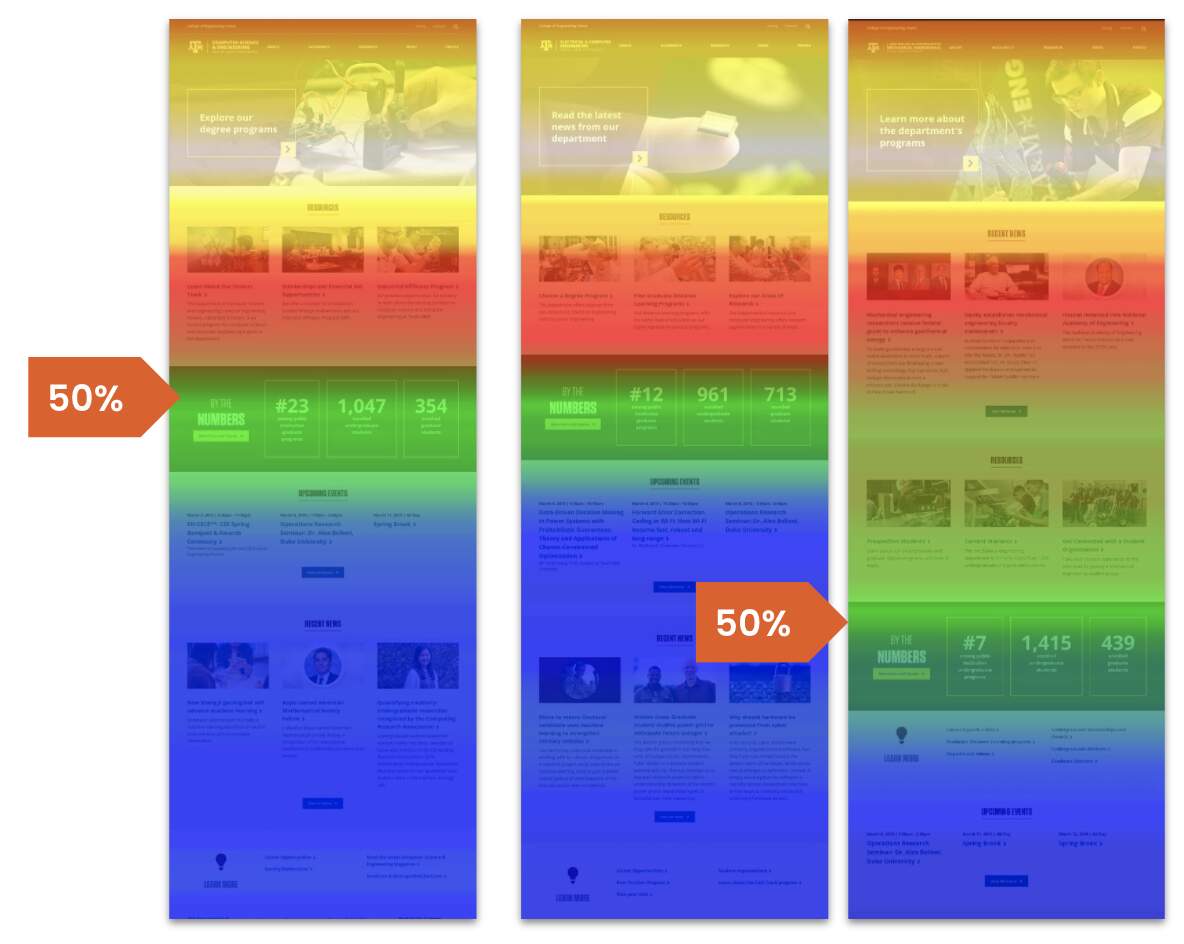
Scroll Heatmaps
Scroll heatmaps illustrate how closely users read to the bottom of a page and where attention drops off. They show whether any significant content, CTAs, or trust signals are positioned too far down the page to be seen. A scroll map helps teams redesign pages so that key messages align not with the imagined process of reading but with actual viewing behavior.
-
Move / Attention Heatmaps
Moving or attention heat maps tracking the movement and hover behavior of mice tell a story about visual hierarchy and areas of focus. Not as good as eye tracking, of course, but they can spot distractions, design clutter, and blockers to conversion flows, which make your user experience insights even clearer.
-
Mouse Tracking Heatmaps
Mouse tracking heatmaps focus specifically on cursor paths and pauses, showing how users explore a page before acting. Long pauses, looping movements, or repeated hovering often signal confusion or hesitation. These insights help teams understand decision-making behavior, refine content flow, and support better UX optimization by addressing uncertainty points before users abandon the page.
-
Eye Tracking Heatmaps
Eye tracking heatmaps (from studies or simulations) show where users visually focus, revealing what content truly captures attention. They help validate headline placement, imagery effectiveness, and CTA visibility. When combined with other heatmaps, eye tracking data strengthens website usability improvement by confirming whether design elements attract attention where it matters most.
-
Insights Across Heatmap Types
The resulting heatmaps, when combined, show us interaction gaps, visibility problems , and design friction. They are supportive of UX improvement, helping you see how users will react to layout, space, and visual prompts in the real world and to website usability (rather than aesthetics).
What Session Recordings Reveal About Users
Session recordings help you see what real visitors actually do on your website. Instead of guessing how users move around, hesitate, or leave a page, you can watch full visits from start to finish. This makes it easier to understand where people feel confused, stuck, or unsure. Because of this, session recordings are one of the most useful website optimization tools, especially when regular analytics do not explain what is going wrong.
Learning From Session Recordings
| User Behavior Observed | What It Reveals | Why It Matters |
| Repeated back-and-forth navigation | Confusion about page structure or next steps | Indicates unclear hierarchy or missing guidance |
| Rage clicks on buttons or links | User frustration with broken or unresponsive elements | Highlights technical or UX blockers |
| Cursor hesitation over form fields | Uncertainty or cognitive overload | Signals where instructions or labels need clarity |
| Abandoned forms or checkouts | Friction in conversion paths | Directly impacts conversion rate optimization |
| Mobile zooming or mis-taps | Poor mobile spacing or layout | Reveals device-specific usability issues |
Some problems are hard to spot with numbers alone. Session recordings reveal emotional reactions such as frustration, hesitation, or uncertainty. For example, you may notice users repeatedly clicking the same button, pausing for long periods, or moving back and forth between pages. These signs explain why users behave the way they do, not just what they did. This leads to clearer user experience insights based on real actions instead of assumptions.
When session recordings are reviewed regularly and grouped by device or traffic source, they become a useful learning tool. Teams can spot patterns, fix small issues early, and improve user journeys step by step. This helps create smoother experiences and better results without making big changes based on opinions alone.
How Heatmaps Improve CRO
Heatmaps help teams understand where conversions quietly fail on a website. By showing where users click, how far they scroll, and which areas they pay attention to, heatmaps reveal whether CTAs are seen or ignored. They also show whether users interact with page elements as expected. This type of analysis highlights the gap between how a page was designed to work and how users actually use it, helping teams focus on changes that truly improve conversions instead of making surface-level updates.
Page layout and visual flow directly impact conversion success. Heatmaps show whether users naturally move toward important actions or get distracted by other elements. When key content is placed too low or competes with less important items, users often miss it. Adjusting layout based on real interaction patterns leads to clear website usability improvement without needing more traffic or a full redesign.
Heatmaps also make testing more effective. Instead of guessing what to change, teams can use heatmap data to decide which elements need attention before running tests. This leads to smarter A/B testing and better use of time and resources. When decisions are based on real user behavior, conversion improvements become more consistent and sustainable over time.
Using Heatmaps to Improve Content & SEO
Heatmaps help ensure that important content is actually seen, not just published. Many pages technically include strong headlines, internal links, or CTAs, but place them below natural attention zones. By analyzing scroll and click patterns through website heatmap analysis, teams can confirm whether users reach critical sections or abandon the page before key messages appear. This allows content to be reordered based on real visibility rather than assumed reading behavior.
Heatmaps also reveal how users interact with internal links and supporting content. When links receive little attention, or clicks cluster around non-essential elements, it often signals misplaced priorities or unclear visual cues. Adjusting placement and hierarchy based on interaction patterns improves discoverability and strengthens internal linking, which supports both engagement and crawl efficiency. These adjustments yield clearer user experience insights, which, in turn, indirectly reinforce SEO performance.
From an SEO perspective, better content visibility improves engagement signals that search engines increasingly value. When users scroll further, interact more, and spend time engaging with meaningful sections, pages send stronger quality signals. By aligning layout and content structure with observed behavior, teams improve SEO outcomes through usability improvements rather than keyword manipulation. This approach supports sustainable visibility as search continues to prioritize user satisfaction and clarity.
Improving Forms & Funnels with Recordings
Forms, checkouts, and lead funnels are where intent turns into action, or breaks down completely. Even small moments of confusion or friction can stop users from converting. Session recordings make these moments visible by showing how real users navigate critical steps, where they hesitate, and what ultimately leads them to leave.
- Session recordings help identify where users struggle while filling out forms, such as pausing too long, retyping information, or abandoning fields midway. These patterns highlight unclear labels, unnecessary fields, or instructions that confuse users.
- Watching real sessions makes it easier to spot checkout problems that analytics alone cannot explain. Users may hesitate over pricing, get stuck on validation errors, or abandon the process due to unexpected steps. Fixing these issues improves website usability improvement without redesigning the entire flow.
- Lead funnels often fail due to small friction points rather than a lack of interest. Session recordings show exactly where users drop off, helping teams simplify steps, reduce distractions, and guide users more clearly toward completion.
- Mobile behavior often differs significantly from desktop behavior. Recordings reveal issues like mis-taps, excessive scrolling, or zooming on forms, which helps teams optimize layouts for smaller screens and improve overall UX optimization.
- By regularly reviewing recordings, businesses can make continuous improvements to forms and funnels rather than only reacting when conversion rates drop. This creates smoother journeys and stronger performance over time.
When used consistently, session recordings turn hidden friction into clear opportunities. They allow teams to refine forms and funnels based on real behavior, leading to higher completion rates, better user satisfaction, and more reliable conversions without increasing traffic.
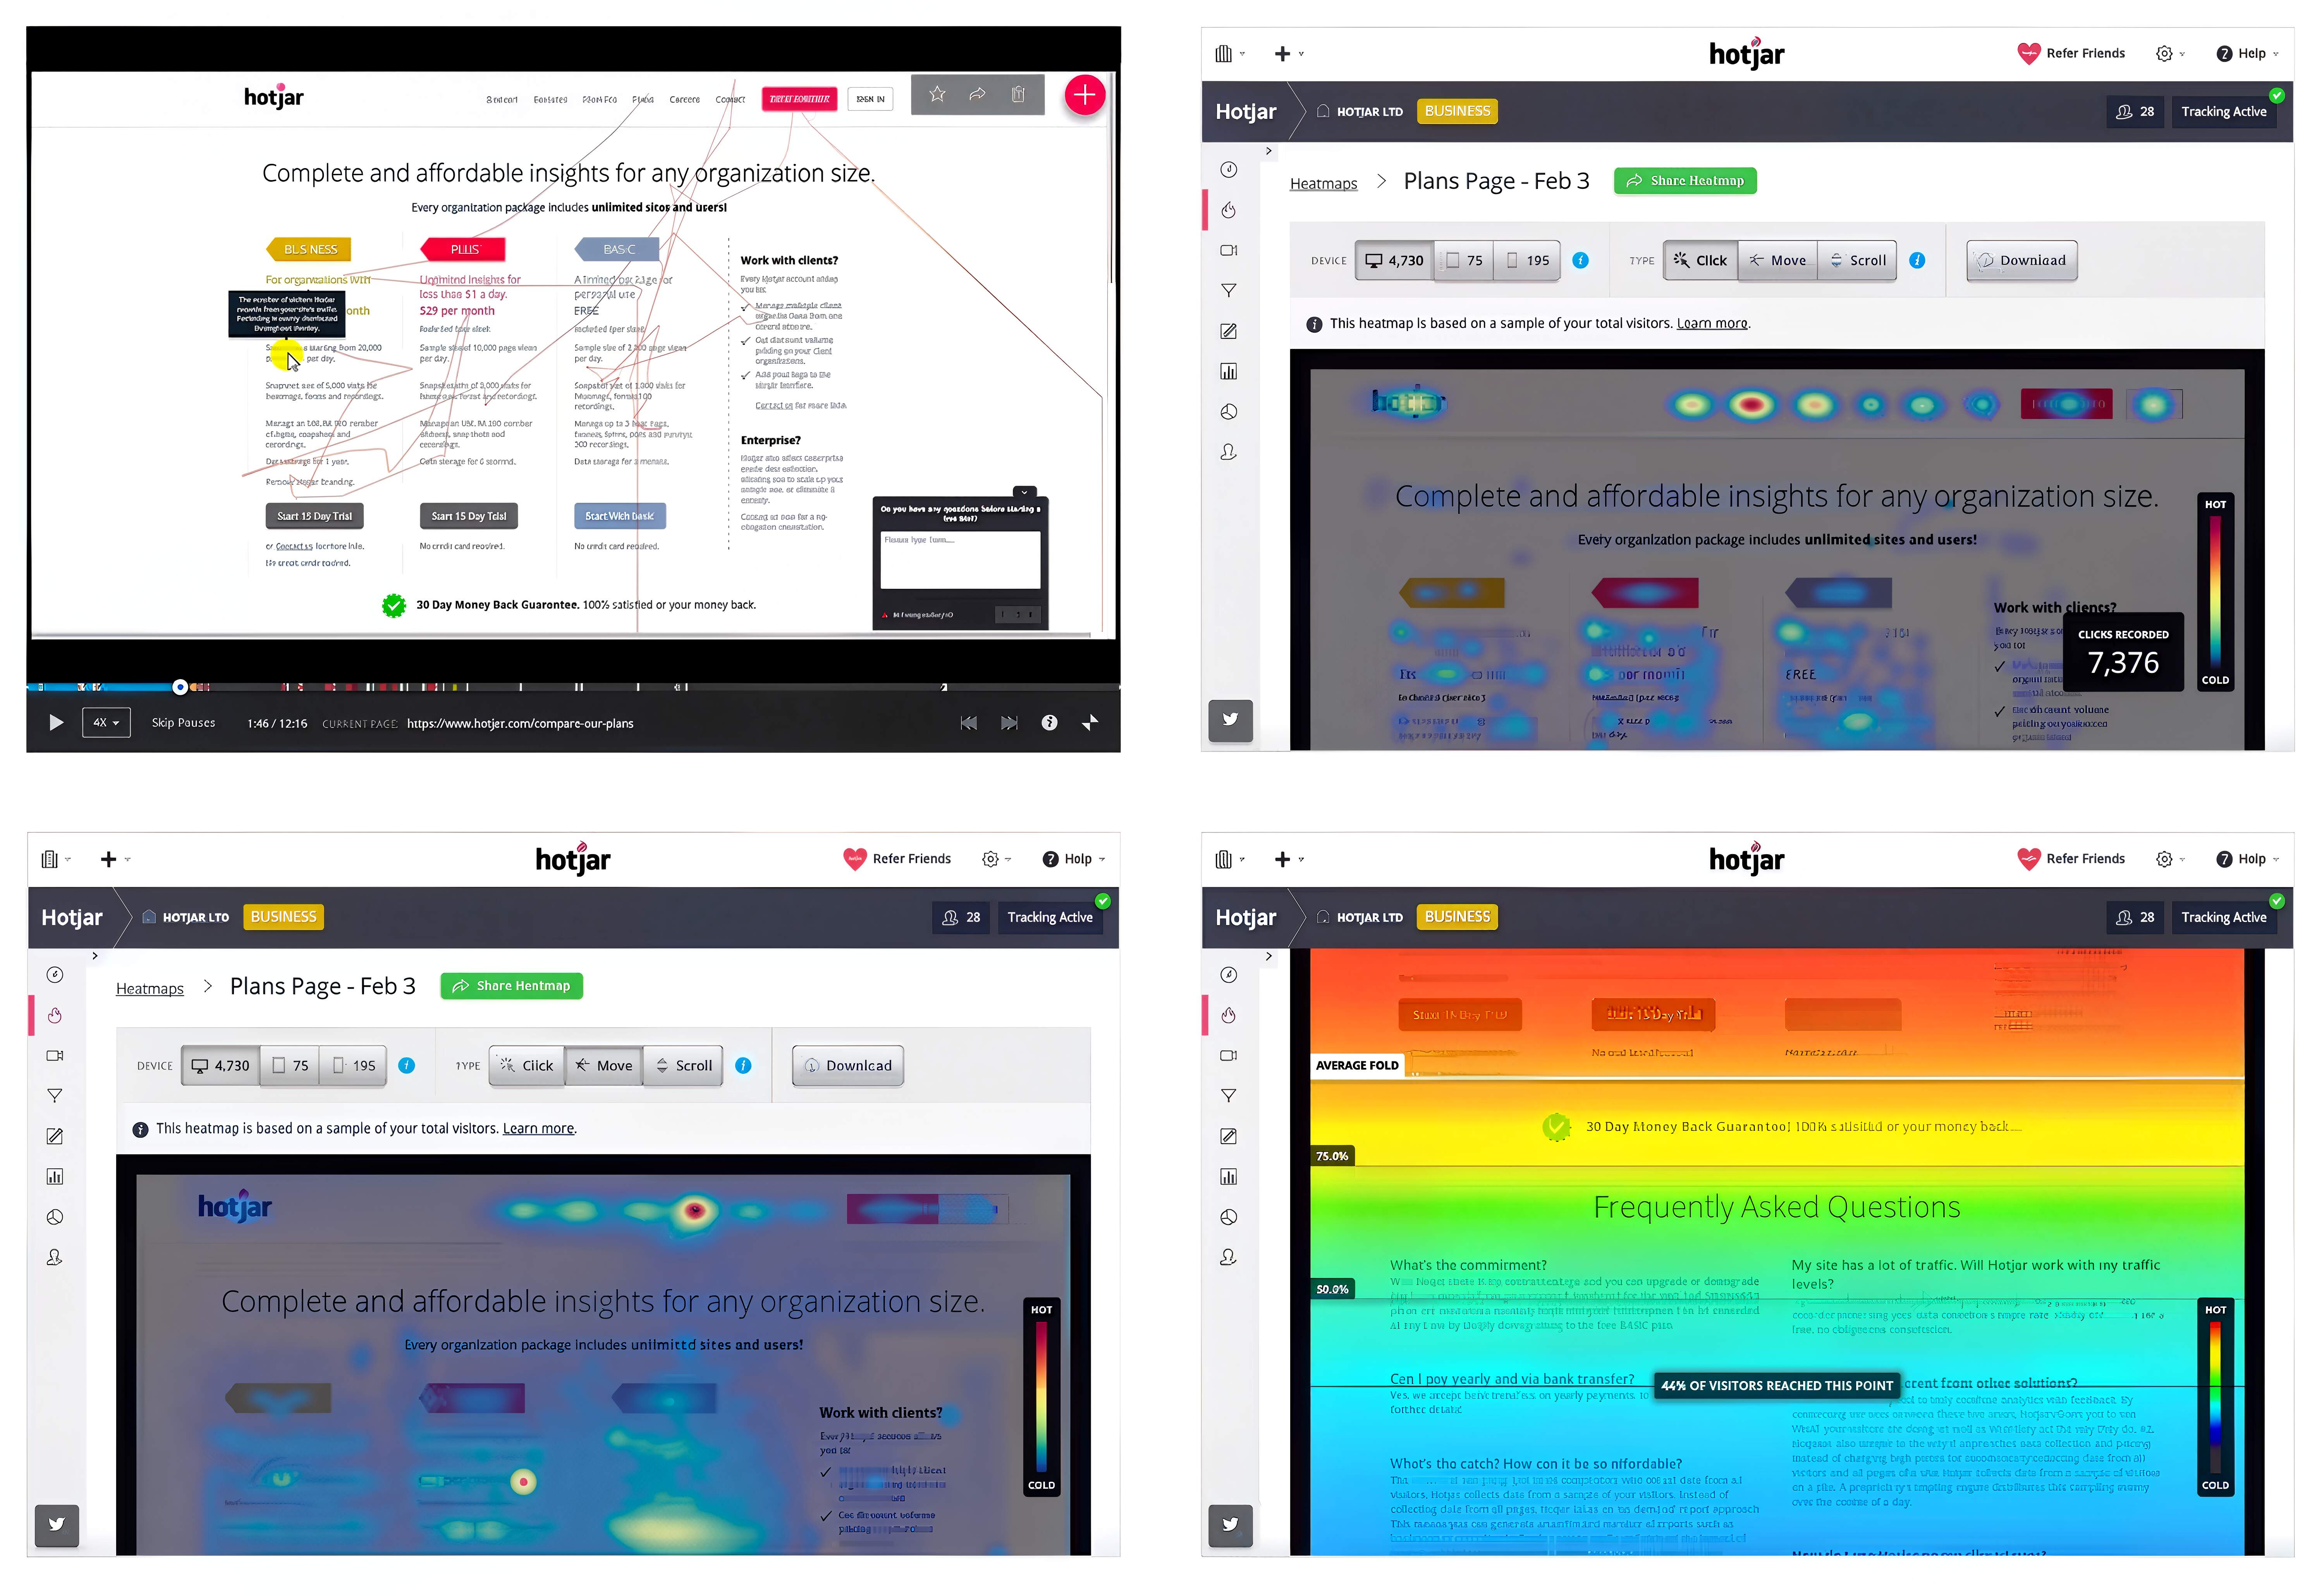
Popular Heatmap & Session Recording Tools
Different tools offer different strengths, but they all serve the same purpose: helping teams understand how users actually behave on a website. Choosing the right tool depends on budget, goals, and the depth of insight required.
Hotjar is one of the most popular website optimization tools for understanding on-page behavior. It offers heatmaps, session recordings, and simple feedback polls. Hotjar is easy to set up and works well for identifying obvious friction points, ignored content, and form issues, especially for small to mid-sized websites.
Microsoft Clarity is a free tool focused on session recordings and heatmaps. It highlights rage clicks, dead clicks, and excessive scrolling, making it useful for quickly spotting frustration. For teams starting with user behavior analytics, clarity provides strong insights without cost or complexity.
Crazy Egg focuses heavily on visual behavior analysis, offering click maps, scroll maps, and snapshot comparisons. It is helpful for testing layout changes and understanding how users respond to design adjustments over time. It supports simple A/B testing tied to behavior patterns.
Mouseflow provides detailed session recordings, form analytics, and funnel tracking. It is useful for diagnosing form abandonment, checkout friction, and multi-step funnels where users unexpectedly drop off. Teams often use it for deeper UX optimization work.
-
Privacy & Compliance Considerations:
When using any behavior tool, it is important to manage data responsibly. Most tools offer masking options to protect sensitive information and comply with privacy regulations, which should always be configured before data is collected.
Turning Insights into Actionable Changes
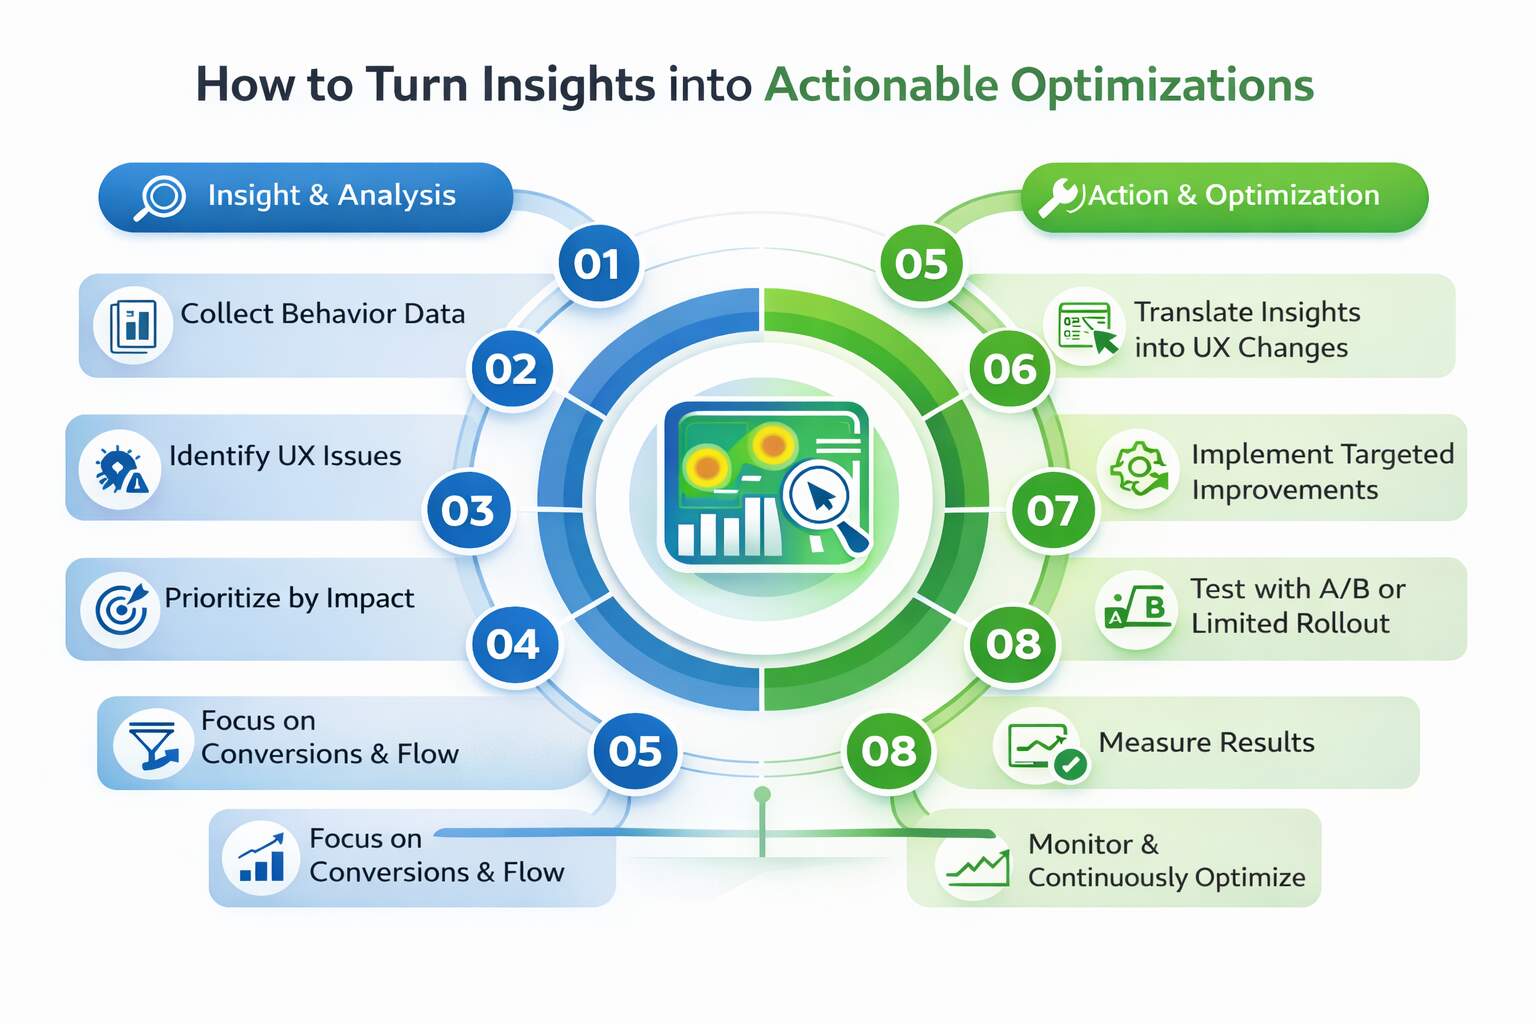
Collecting behavior data is only useful if it leads to action. Heatmaps and recordings often reveal multiple issues at once, but not all problems deserve equal attention. Teams should start by prioritizing issues by impact, focusing first on those that affect conversions, engagement, or user flow. This approach keeps website optimization tools from becoming passive reporting systems and turns insights into meaningful improvements.
Once priorities are clear, observations must be translated into specific UX changes. For example, if users miss a CTA, the fix may involve repositioning it, adjusting contrast, or simplifying surrounding content. If recordings show hesitation during forms, reducing fields or clarifying labels can remove friction. These small, targeted changes often lead to noticeable gains because they align with real user experience insights rather than assumptions.
Before rolling out changes across the site, testing is essential. A/B tests or limited updates help confirm whether adjustments actually improve behavior. Measuring performance before and after changes ensures decisions are backed by evidence, not opinions. Over time, this cycle of observation, action, and measurement creates steady improvement driven by behavioral data analysis, making optimization a repeatable process instead of a one-time effort.
Mistakes In Heatmaps and Recordings
- Collecting Heatmaps and session recordings without goals leads to data overload and unclear optimization priorities.
- Reacting to single sessions leads to incorrect conclusions rather than reliable patterns from real user behavior.
- Ignoring device or traffic segments hides critical issues affecting mobile users or high-intent visitors’ journeys.
- Treating visual clicks as truth overlooks intent, context, and accessibility limitations in users’ interactions.
- Relying solely on recordings ignores the quantitative metrics needed to validate scale and business-impact outcomes.
- Failing to act on insights wastes time, budget, and learning opportunities discovered through observation cycles.
- Stopping analysis after changes prevents learning whether fixes improved journeys or created new friction points.
The Closing Thoughts
Most websites do not fail because they lack traffic. They fail because teams make decisions without fully understanding how users behave. Traditional metrics explain outcomes, but they rarely explain intent. Tools like Heatmaps and session recordings close this gap by showing where users click, scroll, hesitate, or leave. This visibility helps businesses stop guessing and start improving based on real behavior.
When used consistently, behavioral insights lead to better layouts, clearer messaging, and smoother user journeys. Small fixes; such as moving a CTA, simplifying a form, or removing distractions, often create meaningful gains. Over time, this approach strengthens UX optimization, improves trust, and supports long-term conversion rate optimization without increasing ad spend or traffic volume.
The real advantage is clarity. Instead of reacting to performance drops, teams understand why users struggle and can fix issues before they become costly. Websites evolve to match real user expectations, not internal assumptions, making optimization more effective and sustainable.
Are You Listening To Your Users?
Want to know why users don’t convert on your website? Let eSign Web Services analyze real user behavior and deliver dacta-backed UX and CRO improvements that drive measurable results. We identify friction points, confusion areas, and missed opportunities hidden inside real user interactions. Contact us today or get a free quote to turn visitor behavior into clearer journeys and higher conversions.
Frequently Asked Qustions (FAQs)
Question: When should a business start using heatmaps and session recordings?
Answer: A business should start using heatmaps and session recordings as soon as it has steady traffic and defined goals. You don’t need massive numbers to gain insight, consistent visits to key pages are enough to spot patterns. If people are landing on important pages but not converting, behavioral tools help uncover why. Starting early prevents small usability issues from growing into bigger revenue problems and supports smarter, data-backed improvements instead of relying purely on assumptions or guesswork.
Question: How do heatmaps help improve content placement on a page?
Answer: Heatmaps visually show where users focus, click, or scroll past, making content placement decisions far more intentional. Instead of guessing where to position headlines, value propositions, or calls-to-action, you can align them with natural user attention patterns. If important sections are ignored, heatmaps reveal that quickly. This insight allows teams to move critical elements higher or restructure layouts so the most persuasive information appears exactly where visitors are already looking and engaging.
Question: What role do session recordings play in diagnosing form issues?
Answer: Session recordings let you watch real user interactions with forms, revealing friction you might otherwise miss. You can see hesitation, repeated edits, error triggers, or abandonment moments. These behaviors often point to confusing instructions, too many fields, or technical glitches. Instead of assuming why users drop off, recordings show the full journey. That clarity helps simplify forms, improve field clarity, and reduce frustration—leading to higher completion rates without increasing traffic or offering additional incentives.
Question: Can behavioral tools help identify messaging problems?
Answer: Yes, behavioral tools are powerful for uncovering messaging gaps. If users scroll past headlines, ignore calls-to-action, or repeatedly hesitate, it may signal unclear or unconvincing copy. Heatmaps reveal whether key messages attract attention, while session recordings show how users respond in context. These patterns highlight disconnects between what visitors expect and what the page communicates. With that insight, teams can refine messaging to better match user intent and improve engagement naturally.
Question: How do heatmaps support mobile optimization efforts?
Answer: Mobile heatmaps reveal how users tap, scroll, and interact on smaller screens, which often differs from desktop behavior. They show if buttons are hard to reach, content appears too far down, or spacing creates accidental taps. Because mobile users behave differently, simply shrinking a desktop layout rarely works well. Behavioral insights guide mobile-first adjustments that feel intuitive and seamless, ensuring important content is accessible and easy to engage with on handheld devices.
Question: Should heatmaps and recordings be used before or after redesigns?
Answer: They should be used both before and after a redesign. Before changes, behavioral data highlights genuine friction points so teams focus on solving real problems rather than redesigning blindly. After launch, recordings and heatmaps confirm whether updates improved user flow or introduced new obstacles. Skipping either stage increases the risk of repeating ineffective changes. Using behavioral tools throughout the process ensures redesigns are grounded in evidence and validated by real user interaction.
Question: How do behavioral insights support A/B testing decisions?
Answer: Behavioral insights help prioritize what to test by revealing exactly where users struggle or disengage. Instead of testing random design tweaks, teams can focus on elements backed by clear behavioral evidence. This makes A/B testing more strategic and increases the likelihood of meaningful performance gains. When tests are informed by real friction points, results tend to be clearer and more actionable, reducing wasted effort on experiments that lack purpose.
Question: Can heatmaps and recordings reveal trust issues on a website?
Answer: Absolutely. When users hesitate around pricing, testimonials, or forms, it often indicates uncertainty or missing reassurance. Heatmaps may show repeated scrolling or hovering, while session recordings reveal pauses and exits. These subtle signals highlight trust gaps that standard analytics can’t capture. By identifying where confidence drops, businesses can strengthen credibility with clearer explanations, social proof, or transparency, improving conversions without relying on aggressive or pushy tactics.
Question: How often should behavioral data be reviewed for ongoing optimization?
Answer: Behavioral data should be reviewed consistently, especially after updates, campaigns, or noticeable traffic shifts. For many small to mid-sized businesses, monthly reviews or campaign-based check-ins are sufficient. The key is maintaining a steady feedback loop. Regular monitoring helps catch new friction early, preventing gradual performance declines. Ongoing analysis ensures your website evolves alongside user behavior rather than falling behind changing expectations or unnoticed usability challenges.
Question: What is the biggest long-term benefit of using behavior tools consistently?
Answer: The biggest long-term benefit is alignment between your website and real user behavior. Over time, consistent behavioral analysis shapes clearer navigation paths, stronger messaging, and smoother interactions. Instead of reacting to sudden drops or relying on assumptions, teams build a proactive improvement cycle. This creates steady growth, stronger engagement, and more predictable conversions. Ultimately, your website becomes a reflection of how people truly use it; not how you assume they do.
Author Details

Ashwani Kumar Sharma
Ashwani has been actively involved in SEO services since 2005. His expertise and distinctive work approaches have made him one of the most experienced and trusted SEO experts in the industry. He is a certified SEO and Google Ads professional. He also has strong business development skills in advanced SEO, PPC, and digital marketing strategies.